PRICE REDUCED to $1,125.00
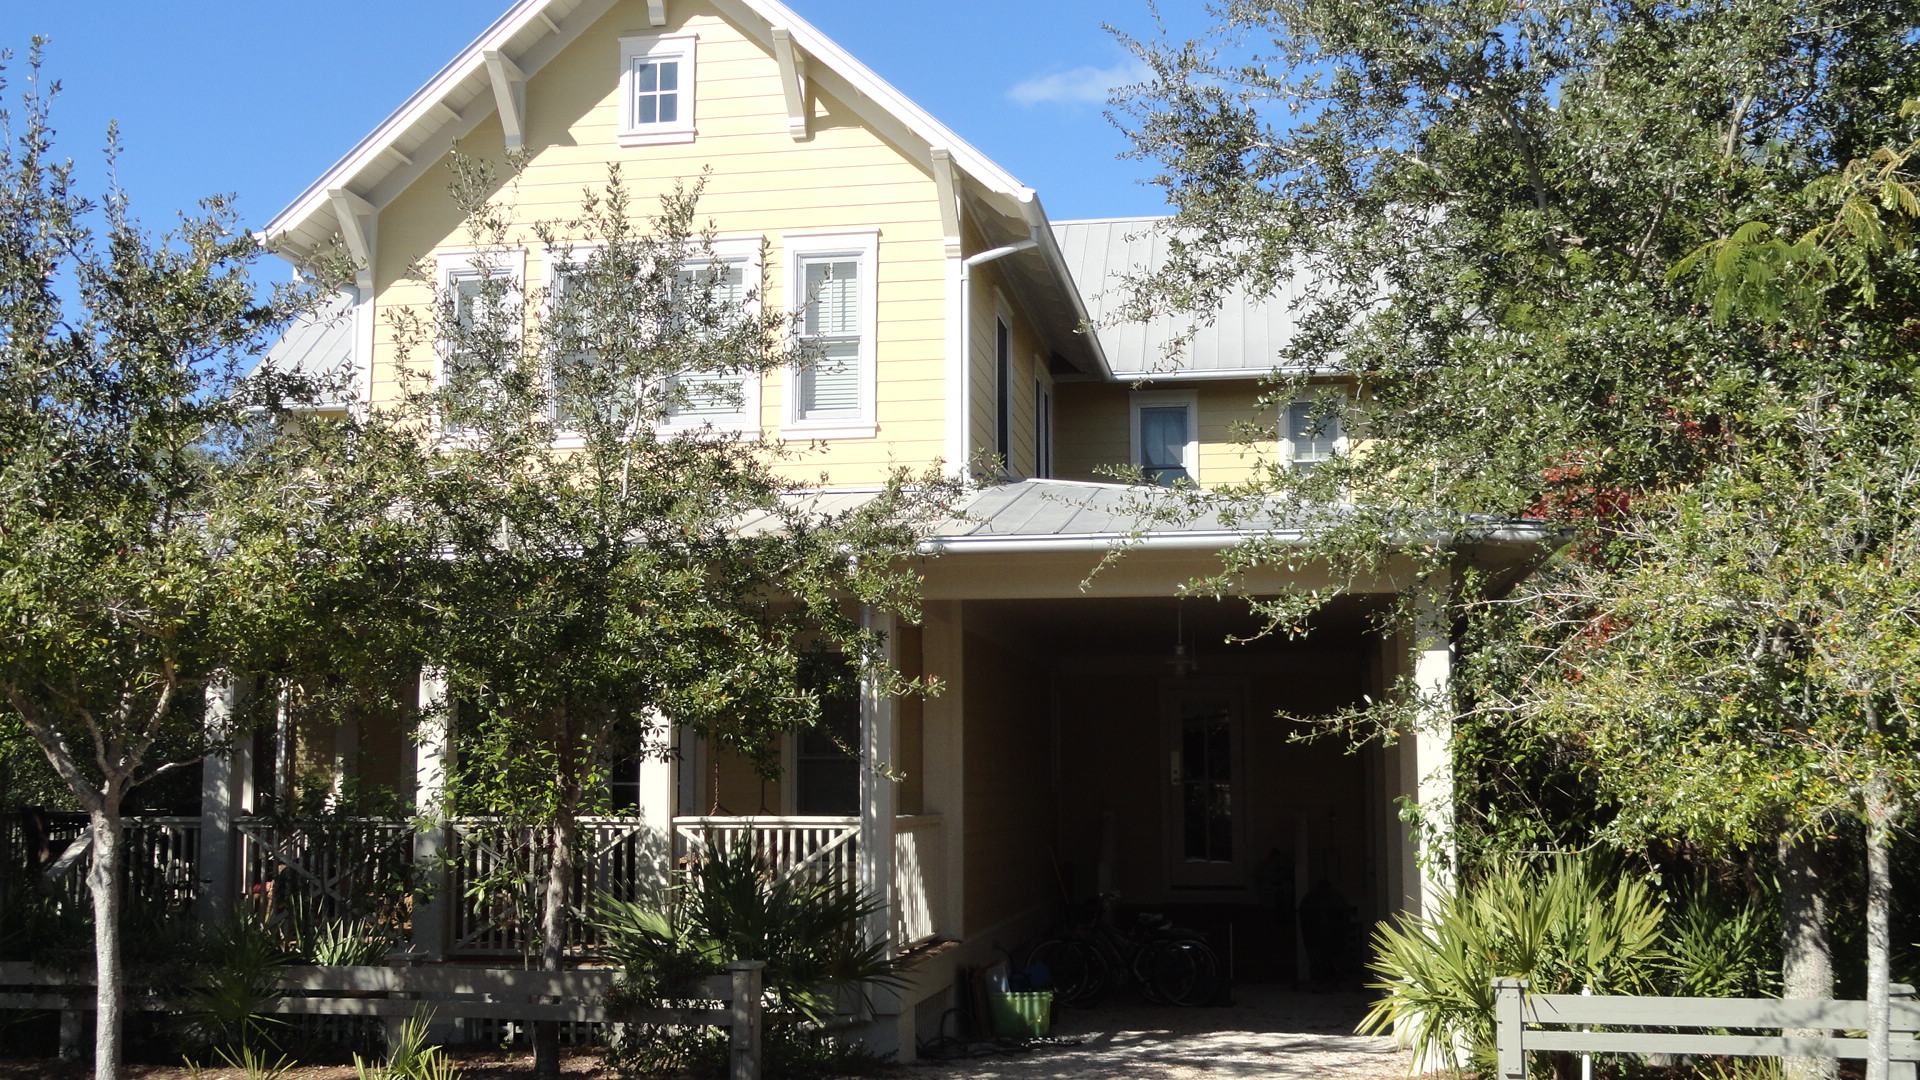
102 Red Cedar Way
Watercolor, Florida 32459
Year Built: 2004
Style: Florida Cottage
4 Bedrooms
5 Baths
2,772.00 SqFt
Don’t miss this opportunity. This is the largest home for the money in the Camp district of Watercolor. Just Steps away from Camp Watercolor, this fabulous home was built by Monte Hewitt Homes. Home is being sold furnished excluding art. This wonderful home features 4 bedrooms, all with private baths, including one main floor bedroom. The wonderful Master suite features a private screened porch. The open floor plan is great for entertaining large groups. The spacious kitchen features custom stained cabinetry, stainless steel appliances and center island. The open living and dining area features a fireplace and screened porch with additional seating for outdoor dining. The expansive wrap-around porches are great overflow areas when entertaining large groups. Located beside the home is one of the many nature trails in Watercolor. Located on a private and wooded lot, makes this home an appealing property. .5% of sale paid at time of close to St. Joe Community Foundation.
Karen Holder
Broker Owner
Homes on 30a
850.687.1064